Introduction
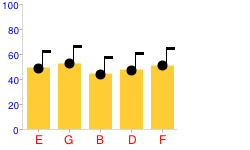
The HTML standards enable you to specify hot spots on a web page image using an image map. These hot spots can be used to display hovertext or act as links, or you can even add JavaScript event handling to enable interactivity. For instance, hover your mouse over the bars and axis labels of the following image:

These hot spots are made using the <map> and <area> HTML
elements. The Chart API can return all the coordinates needed to make a hot spot
map for it, as described next.
Creating a Map for Your Chart
If you add the parameter chof=json to
your chart URL, you will receive back a JSON string that includes all the data
you need to create an image
map for your chart. You can then add links
to specific sections of your chart, or attach JavaScript functions to click events
to make your chart more interactive. Note that not all chart types support this;
see your specific chart documentation for details.
The tool on this page will help you generate the HTML for an image map. You can embed this HTML in your page permanently, or you could even copy our code to your page, and then request and generate the map on the fly, if your page enables the user to change the map on the page dynamically.
Here is how to use this tool to generate a map:
- Get the JSON output for your chart: add
chof=jsonto your chart URL, browse to that URL in your browser, and copy the returned text. - Paste the JSON text you copied into the text box below marked "JSON Output" and click "Make Map".
- Paste the generated map code into your page
- Update the generated code with a unique name for your
<map>element. - Remove any map elements that you don't need (for example, specific bars, slices, labels, or axis elements).
- Update the href attributes in the generated
<area>elements. - Add the attribute
usemap="#MAP_NAME"to your<img>element, substituting your map's name forMAP_NAME.Important: Be sure to prefix the usemap value with '#'. For example:
usemap="#mymap". In this case, the map name is "mymap" not "#mymap".
Format of the JSON String
Here is the format of the JSON returned when you specify chof=json:
- A root object called chartshape. This object holds an array of objects, each
representing one area in an image map of the chart. Each object has the
following properties:
- name - A name for this specific area. The general naming convention is elementtype_series#_item#. For example: bar0_0 for an area describing the first bar in the first series, or axis0_1 for an area describing the second axis label on the x-axis.
- type - The shape of this area. It will be one of the following values,
depending on the chart type: RECT, CIRCLE, or POLY. This is equivalent to
the shape attribute
of the
<area>tag. - coords - A numeric array describing the area; equivalent to the coords attribute of the
<area>tag.
